Live system dashboard — CPU, memory, network, and disk at a glance
See everything happening on your system at a glance
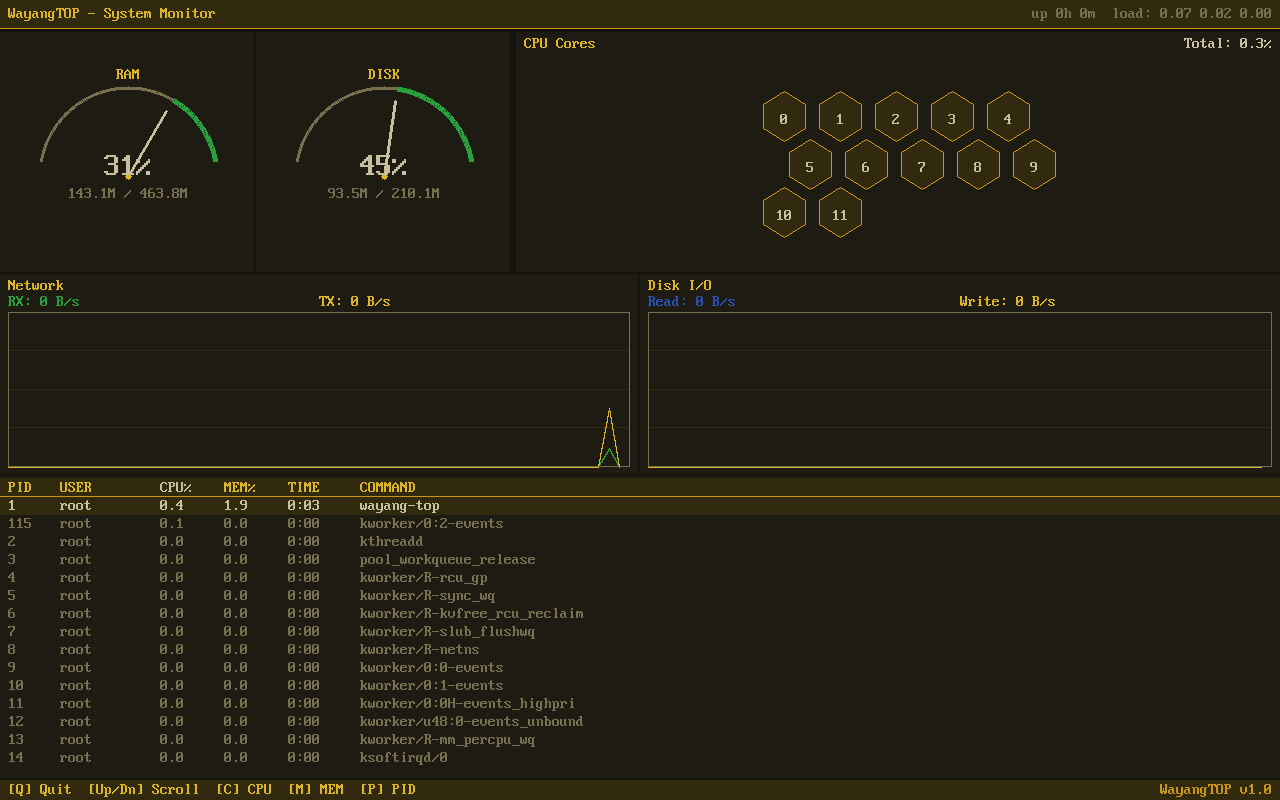
Beautiful real-time system monitor with speedometer gauges, honeycomb CPU display, and live network graphs. Know exactly how your device is performing.
Live system dashboard — CPU, memory, network, and disk at a glance
Real-time performance data, beautifully displayed.
Analog-style gauges for CPU and memory usage. Instantly see how hard your system is working — no numbers to decipher.
Each CPU core displayed as a hexagonal cell, color-coded by load. See at a glance which cores are busy and which are idle.
Scrolling line graphs showing upload and download speeds in real-time. Watch your network activity as it happens.
Live read/write graphs for your storage devices. Spot bottlenecks and see exactly when your disk is being hit hard.
Sortable list of running processes with CPU, memory, and PID. Find resource-hungry processes and stop them if needed.
All metrics refresh continuously. Lightweight enough to run alongside your other apps without slowing things down.
Click any screenshot to enlarge. Navigate with arrow keys.
Welcome Screen
System Dashboard
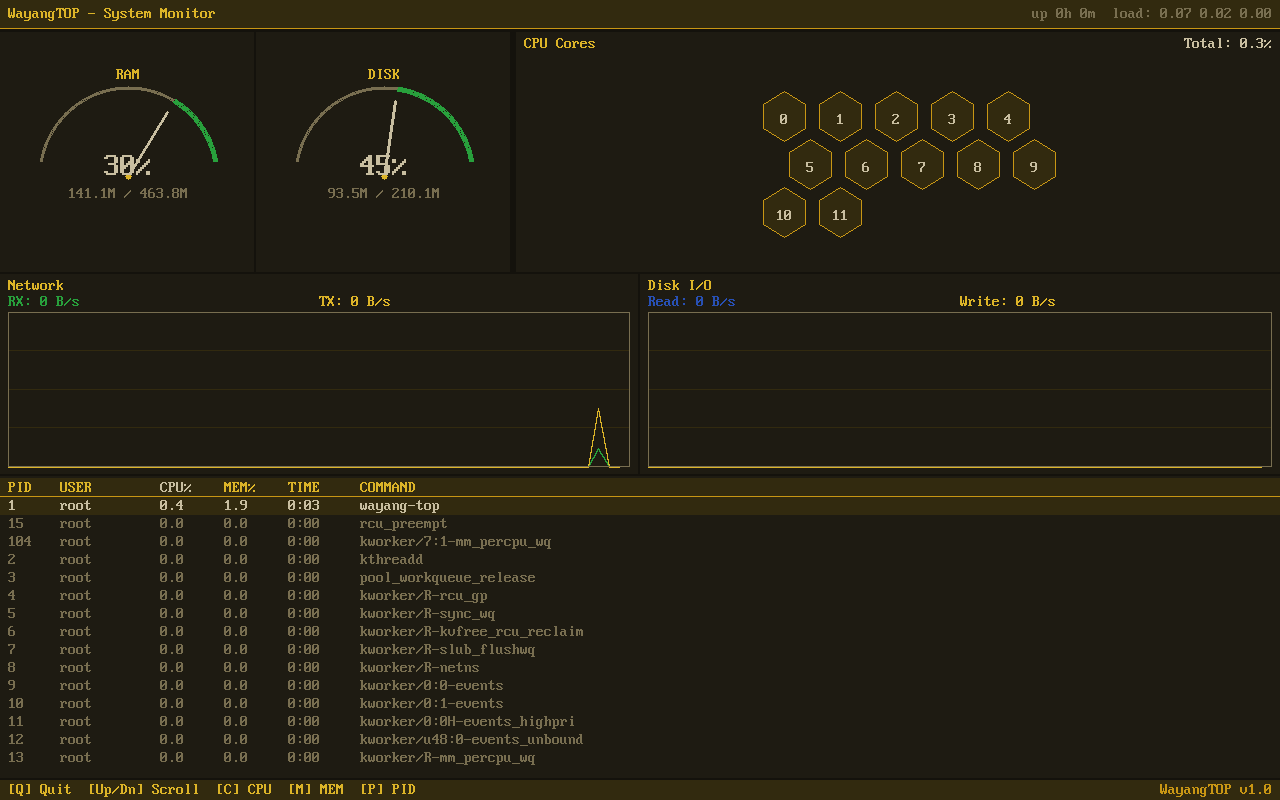
Live Metrics Update
Navigate everything without leaving the keyboard.
| Key | Action |
|---|---|
▲ / ▼ | Scroll through process list |
Tab | Switch between panels |
s | Sort processes (cycle: CPU / Memory / PID) |
r | Reverse sort order |
k | Kill selected process |
q | Quit WayangTOP |